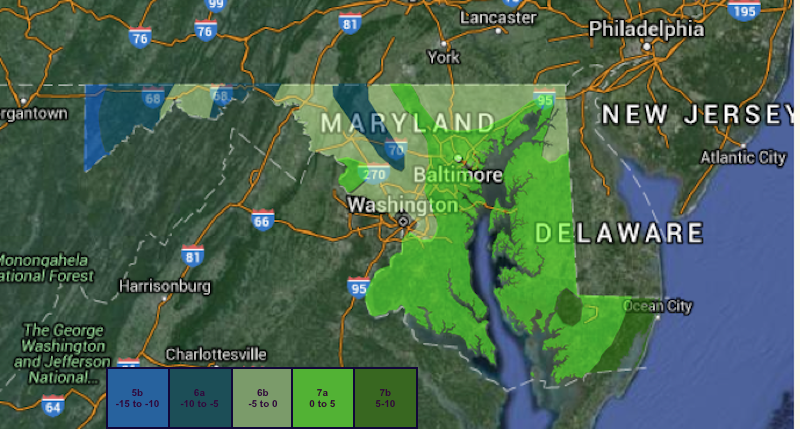
Here is a 1990 map of Maryland which took data and determined what our planting zones were:
Our District V really runs that gamut from 5b to 7a! On this map in Carroll 7a runs from 795, along Rt 140 and up 97 to the PA border.
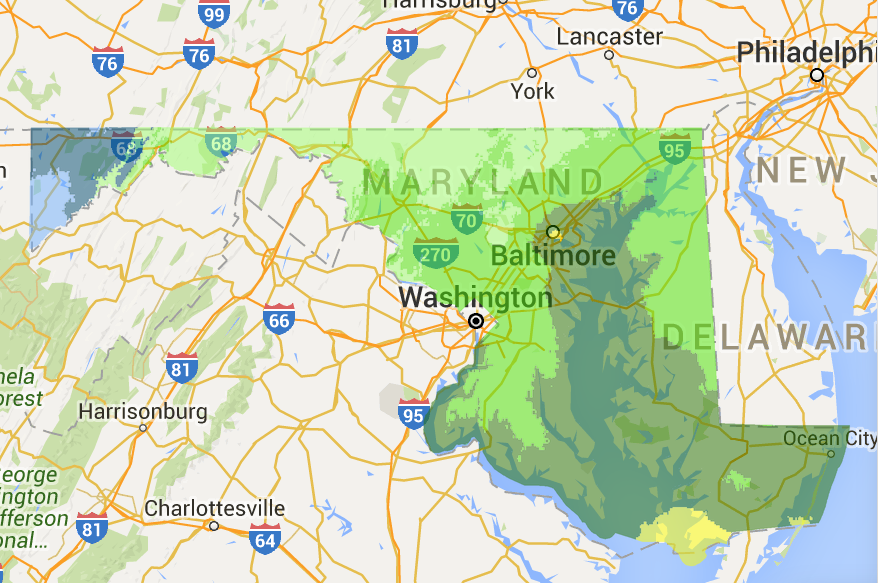
Compare it with the zone map in 2012:
Look at the mustard color around Crisfield–that’s zone 8. Also note how much 7b, the olive tone, has crept north along the Chesapeake. The area along Rt 68 of Washington into Allegany has become warmer from 6b to 6a. 7a has filled in the areas from 270 and 70.
Next look at Carroll County in 2012–you’d have to mentally draw the county borders…
In the older 1990 zone map, 7a ran along I-795 to Rt.140 to 97, north to the Pennsylvania border. Here we see 7a from Mt. Airy to Westminster to Manchester/Hampstead along Rt 27. And that cooler area (New WIndsor, Taneytown, Emmitsburg area is now 6b.
I’d like to hear if you agree or disagree with the zone change as you experience it and why you think the direction for 7a changed in Carroll. Tools used in computation between 1990 and 2012? Population aggregating in one area more than the other? What’s your theory?
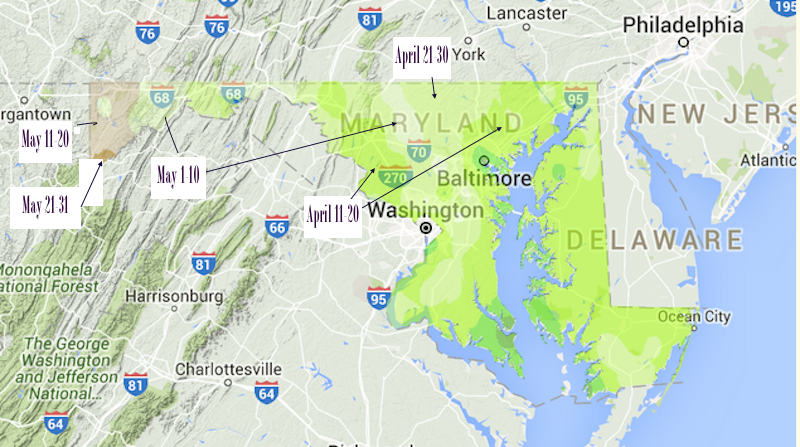
Next we look at last frost dates, which are highly variable around this state from east to west. For example, Baltimore’s average last frost date is said to be Mar 21-31st while way out in western Maryland on the southwestern tip of Garrett County, it is practically a wait until June 1! Here’s some dates for (mostly) District V:
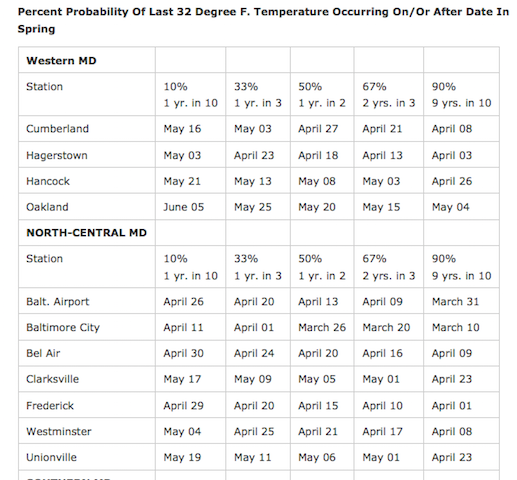
Finally, here is a table from our UMD Extension showing the probabilities of frost by date:
I like this information for planting frost/freeze sensitive plants like tomatoes, beans and cucumbers. Becky RIckell always advised me to wait until after Mother’s Day in our area because too often, we have a frost appear out of the blue earlier than that. So, I wait.


